Skip to content
Survey software for research and insight teams

Every study,start to finish,in one place.

Metalytiq Survey Cloud is the survey platform for the people who program, field and deliver research: a questionnaire you edit visually or in code, quotas that cannot over-fill, a respondent app people finish on a phone, and crosstabs, dashboards and data files that all come from one source of truth. Metalytiq SI, the built-in research assistant, does the routine work when you ask.

Software as a serviceOne subscription for each workspace30-day trial on request

Scroll
Quota sheet · gender × ageIllustrative
An illustration of a quota sheet for a fictional study: target, achieved and remaining interviews for each cell, with a status.
Quota cellTargetAchievedTo goStatus
Male · 18–3415012129At risk
Female · 18–341501500Closed
Male · 35–5415013713On track
Female · 35–5417015812On track
Male · 55+1309931At risk
Female · 55+1507179Behind
Total900736164
n = 736 / 9001 cell closed1 cell behind projection
Crosstab · brand funnel by ageIllustrative
An illustration of a crosstab with column significance letters, for a fictional study.
Brand ATotal18–34 (A)35–54 (B)55+ (C)
Base — all respondents1,554504583467
Aware — spontaneous38%44%BC37%32%
Aware — prompted74%79%C76%C68%
Considered (12 months)41%47%C42%35%
Purchased (3 months)22%27%BC21%18%
Base: all respondentsWeight: wgt_total (rim)Sig: 95%, column proportions
Why teams switch

Where a study loses its hours,and how you get them back.

A study is programmed by one person, fielded by another, answered by a thousand more and delivered by a fourth. The platform is built around what each of them is waiting on.

Survey programmers

Hours back on every script

Import the questionnaire instead of retyping it, edit in the builder or in the code view of the same document, and hand the routine edits to Metalytiq SI.

  • 7 importers, from Word and Excel to Decipher XML and Qualtrics
  • Python scripting with definitions shared across the questionnaire
  • Call blocks and reusable answer lists, written once
  • Simulated respondents find the dead ends before launch
Field managers

Quotas that close themselves

A cell reserves its place inside the transaction that qualifies the respondent, so nothing over-fills and nobody pays for an interview they cannot use.

  • Quota sheets with targets pasted straight from Excel
  • Pace, incidence, length and drop-out by page, live
  • Sample sources with their own links and their own quotas
  • A field report the client opens by link, no account needed
Respondents

Interviews people finish

A respondent app designed for a phone first: one clean page at a time, large targets, grids that become cards, and follow-ups asked in the respondent’s own language.

  • Mobile-first at 375px with 44px tap targets and no sideways scrolling
  • Grids turn into card carousels on small screens
  • AI probes by text or voice when an open end comes back thin
  • 72 question types, themed to the client’s brand
Analysts and clients

Deliverables without the hand-off

Crosstabs, weighting and dashboards run on the live data, and every export is a projection of one frozen datamap, so the SPSS file and the tables always agree.

  • Crosstabs with significance letters and tab specs that re-run per wave
  • Rim weighting with convergence diagnostics
  • Insights dashboards a client can open read-only
  • 18 export formats, identical on every run
Built inMetalytiqSI · Survey Intelligence

A research assistantover your whole workspace.

A research assistant over your Survey Cloud workspace. It reads your surveys and data as you, and changes nothing in Survey Cloud until you press Apply. Ask in plain words, watch what comes back, press Apply. Try one:

Q4 brand tracker · newIllustrative
Here is the Word questionnaire for the Q4 tracker. Draft it.
Drafted 42 questions in six sections, word for word, with codes, routing and three terminations. Two things to check before you create it.
Draft survey · 42 questions
S1 to S6 · screener  2 terminations
Q1 to Q36 · main  4 grids · 1 MaxDiff
S4 · single  no “None of these”
Q17 · grid, 14 rows  heavy on a phone
Create draftDiscard
  • Questionnaires into surveysAttach a Word, PDF or Excel questionnaire and SI drafts the survey, word for word, with codes, routing and terminations — reviewed before anything is created.
  • Edit by askingWording, answer lists, routing, piping, quotas: every change arrives as a diff card you apply or discard.
  • Check before launchA senior researcher’s read: routing that looks ahead, missing "None" answers, phone-sized grids, interview length.
  • Fieldwork todayA morning check-in across every survey in field — pace, incidence, drop-out, quality and quota cells falling behind.
  • Charts and tables in the chatCrosstabs and wave-on-wave comparisons with significance in plain words; add any of them to a dashboard.
  • A desk for programmersThe logic map, test runs with dummy respondents, an expression checker and Python validations, all against the draft.
A study, start to finish

Author, test, launch,field, clean, report.

Author

Build the questionnaire

  • A visual builder and a code view over one document
  • 72 question types, MaxDiff and conjoint among them
  • Loops, call blocks, page layouts and Python scripting
Test

Prove it before launch

  • Preview at phone, tablet and desktop width
  • Simulated respondents and launch warnings
  • Translations side by side, with Excel and XLIFF round trips
Launch

Publish a version

  • Numbered versions with a diff and a rollback
  • Test and live links; short links per survey
  • Email invitations with send-to conditions and bounce handling
Field

Watch it fill

  • Quota sheets whose cells cannot over-fill
  • Field monitor: pace, incidence, length and drop-out by page
  • A field report a client opens by link
Data

Clean with a reason

  • A response grid where every edit records why
  • Speeders, straight-liners and open-end quality flagged
  • Test data and excluded responses hidden by default
Report

Deliver the numbers

  • Crosstabs with significance letters and tab specs that re-run
  • Rim weighting with convergence diagnostics
  • Insights dashboards and 18 export formats from one datamap
Under the hood

Four things the incumbentsget wrong. Watch each one.

Not a feature list. These are the four places a research team loses days, and what the platform does about each.

Authoring

One document, two ways to edit it

The code editor and the visual builder are projections of the same survey document.

  • Switching views is instant and never prompts to save
  • What the builder cannot draw shows as an advanced node, never rewritten
  • Selection follows you across Visual, Code, Split, Document and Flow
CodeIllustrative
VisualIllustrative
What you get

Everything a study needs,and the things only the big suites had.

Quota sheets, choice modelling, AI probes, Python scripting, dashboards and a translation workspace, in one subscription. Every one is live in the product today.

Quota sheets

Quotas as sheets, the way a field team already writes them: cells to assign, targets pasted from Excel, a hook in the flow.

MaxDiff and choice-based conjoint

Design the exercise in the builder, field it, and read utilities and shares under Report › Choice exercises.

AI probes, typed or spoken

A follow-up question on an open end, asked by the model in the respondent’s own language — by text, or by voice with a transcript.

Loop element

Repeat a block over a list or over earlier answers, with question-style flags and masking, and sub-variables in the data.

Python scripting

Punch hidden variables, mask lists and validate answers in pyscript, with shared definitions across the questionnaire.

Call blocks

Write a block once and call it by name wherever the questionnaire needs it, beside the reusable answer lists.

Page layouts

Design how a page is laid out — a table designer and a code view — and apply it per page.

Insights dashboards

Self-service dashboards over an hourly reporting mart, with a designer and a data-status page.

Email management

One simple page per email: a rich template, send-to conditions, bounces and the do-not-contact list.

Translation workspace

Strings in builder order, side by side, with Excel and XLIFF round trips and stale strings flagged.

Simulated data

Run seeded dummy respondents through the draft and read completes, screen-outs and the pages nobody reached.

Shareable field report

A response summary a client can open by link, with download limits and terminate labels.

Works with what you already use

Open atboth ends.

Bring the questionnaire in from Word, Decipher or Qualtrics, and hand the data on to SPSS, Quantum, Stata or R. Every importer and writer is complete, with a conformance test behind it, so nothing arrives half converted.

Every export format is generated from one frozen datamapA single datamap, frozen per survey version, fans out to seven output formats: SPSS .sav, Triple-S XML, Quantum, Fixed-width, Excel, CSV, Datamap. Each format is a deterministic projection of the same metadata, so there is no hand-editing step between the data and a deliverable.Datamapfrozen per versionsingle source of truthSPSS .savTriple-S XMLQuantumFixed-widthExcelCSVDatamapthe same data exported twice produces the same file

Export 18 formats

  • SPSS .sav
  • SPSS syntax
  • Triple-S XML 2.0
  • Triple-S XML 3.0
  • Quantum fixed
  • Fixed-width ASCII
  • Stata .dta
  • SAS transport
  • R .rds
  • R .RData
  • Excel XLSX
  • CSV
  • TSV
  • JSON
  • JSON Lines
  • Datamap JSON
  • Datamap CSV
  • Datamap XLSX

Fixed-width output carries card and column layouts, because a Quantum deck that does not line up is not a deliverable. The same data exported twice produces the same file.

Import 7 formats

  • Decipher survey XML
  • Word questionnaire (.docx)
  • Excel questionnaire template
  • Qualtrics .qsf
  • Triple-S metadata (.sss)
  • SPSS metadata (.sav)
  • Survey document (SDM JSON)

Every import produces a report in three parts (converted exactly, converted with an approximation, not converted) and keeps the original source beside anything it could not translate. A Decipher study comes across with its Python preserved.

Learn it

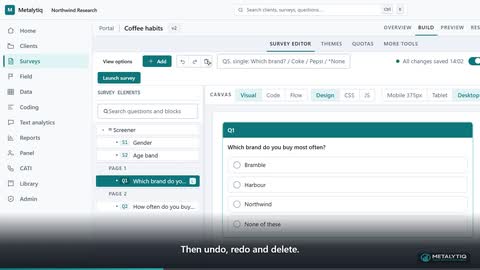
Up and runningin an afternoon.

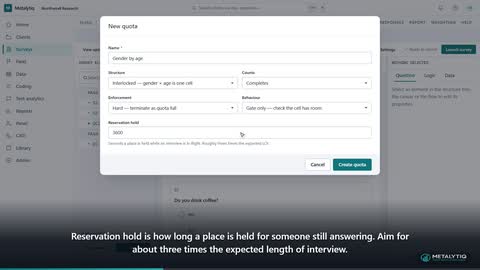
Short animated lessons built from the product’s own screens, from the first survey to a weighted crosstab. They are open to watch, with no account needed.

What is Metalytiq Survey Cloud

2:49 · Metalytiq on YouTube

The survey builder

3:00 · Metalytiq on YouTube

Quotas

2:56 · Metalytiq on YouTube
Pricing

One subscription,sized by users and completes.

Metalytiq Survey Cloud is software you subscribe to. Each organisation has its own workspace on a plan that sets how many people can work in it and how many completes it can collect in a year. Nothing else is metered.

Trial30 days

Freefor 30 days

Enough to author a real questionnaire, put it in field and take the data out again.

Users
5
Completes / year
1,000
Surveys
5
Support
Community support
  • Visual builder and code editor
  • Fieldwork, sample and quotas
  • Data grid, edits and cleaning
  • Exports and datamap
Ask for a trial workspace

Enterprise

On requestsubscription

For multi-market programmes and large, multi-team studies.

Users
Unlimited
Completes / year
Unlimited
Surveys
Unlimited
Support
24×7 support
  • Visual builder and code editor
  • Fieldwork, sample and quotas
  • Data grid, edits and cleaning
  • Exports and datamap
  • Crosstabs and significance testing
  • Rim and cell weighting
  • Dashboards
  • Public API and webhooks
  • SSO (SAML / OIDC)
  • SCIM provisioning
  • Custom domain
  • AI probes on open ends
Talk to us

Paid plans are quoted for your team and volume. Compare the plans in full.

See it ona study of yours.

Send us a questionnaire you have fielded before and we will walk you through it in the product, from the import to the tables. A trial workspace runs for thirty days, with its own isolated database.